
Making a Commitment to diversity, equity and inclusion
10 diversity, equity and inclusion goals for 2019 and 2020
Read more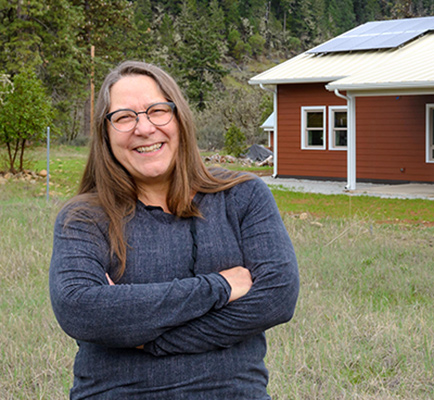
Helping customers do more with less energy
A family grocery, rural retirees and a food processing plant are saving energy
Read more
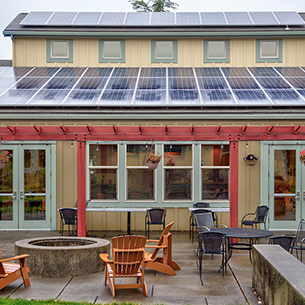
Helping customers invest in green power
A school, irrigation district and tribal health center are generating clean power
Read more
Impact In Our Communities
We've helped families, businesses, factories and farms across Oregon and Southwest Washington use less energy and invest in renewable power.
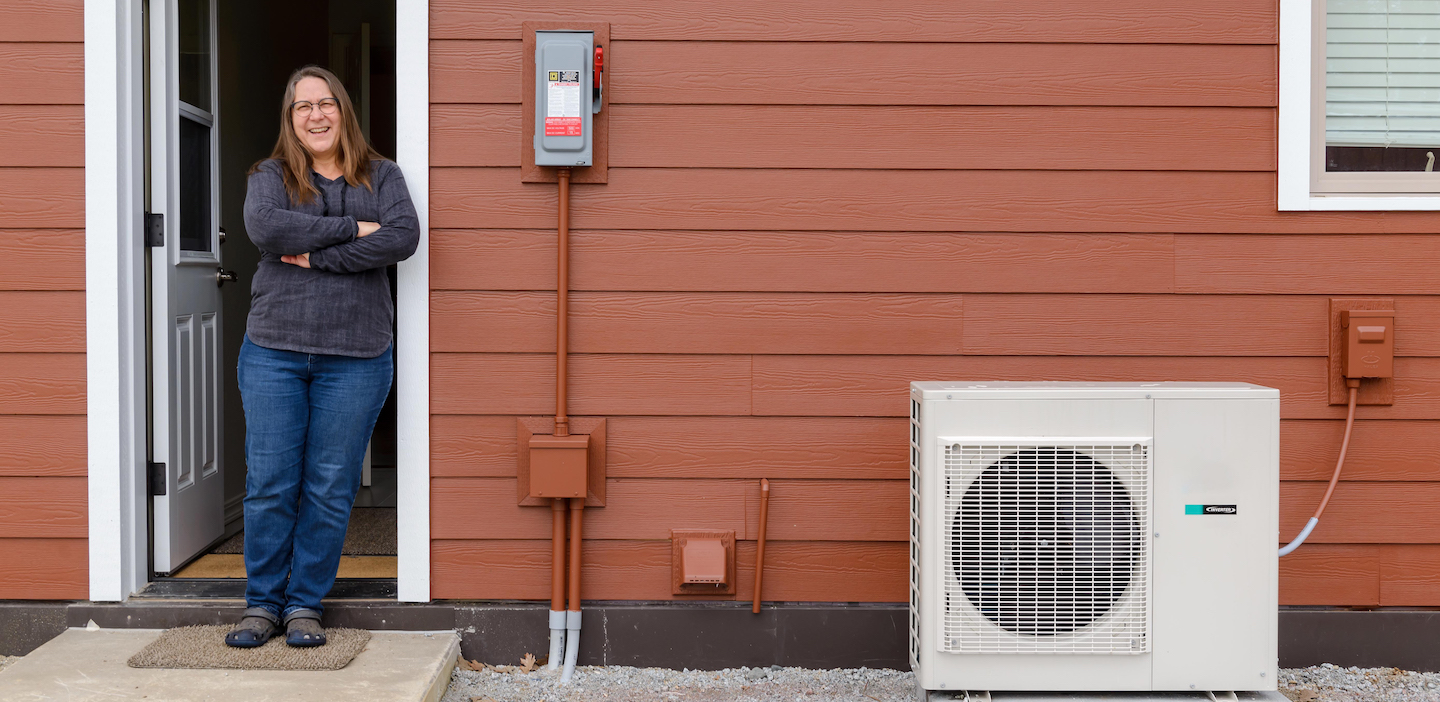
Efficient new home cuts energy costs for rural residents
"Our home is warm, cozy and oh so quiet. And with Energy Trust incentives, it didn’t cost any more than standard construction."
Read More- Insulation
- Highly insulated 10” walls
- Ductless Heat Pump
- Ductless heat pump
- Windows
- High-performance windows
Helping customers do more with less energy


High school aces energy-efficient design
"The goal is to make the school net zero—reducing operating costs and using that money for books and technology that enhance our students' learning experience."
Read More- Solar
- Solar-ready infrastructure for a future roof-mounted solar system
- HVAC
- Heating and cooling system recovers and reuses waste heat
- Windows
- High-efficiency windows
- Parking Lot
- Parking lot solar system
250-kilowatt
Helping Customers Invest in Green Power


Making a Commitment to Diversity, Equity and Inclusion
We believe it is our
responsibility to design
programs so that all
customers can directly
benefit from our services,
including people with low
and moderate incomes,
communities of color and
rural communities.
That’s why we developed 10 diversity,
equity and inclusion goals in 2018 that
will challenge us to identify customers
who are not participating in our programs,
explore new program designs to reach those
customers, establish relationships with
organizations who work with and represent
those customers, and better reflect the
communities we serve.

-
- Report on Progress to Goals
- Publish the diversity, equity and inclusion operations plan and progress towards its goals.
- Measure Progress
- Develop systems and support needed to collect, track, analyze and report demographic information related to program participation, program delivery and Trade Ally Network members.
- Hire More Diverse Staff
- Increase the diversity in recruitment and hiring of employees by 25 percent.
-
- Expand Trade Ally Network
- Increase participation in the Trade Ally Network by minority-owned and women-owned businesses by 50 percent.
- Expand Trade Ally Projects
- Increase the number of projects completed by minority-owned and women-owned trade allies by 15 percent.
- Diversify Contracts
- Increase the number of contracts executed with minority-owned and women-owned businesses by 15 percent.
-
- Build Relationships
- Increase market awareness and understanding of underserved populations by developing and deepening relationships with up to 50 organizations.
- Increase Awareness
- Increase organizational cultural awareness to create a more inclusive work environment where all employees feel welcome.
Savings + Generation Results
We delivered strong electric savings and exceeded natural gas saving and renewable generation goals.
-
54.0 aMW
95% of 56.6 aMW goalReview the breakdownPGE34.7 aMW95% of 36.4 aMW goalPacific Power19.3 aMW96% of 20.2 aMW goal -
7.5 MMTh
114% of 6.6 MMTh goalReview the breakdownNW Natural6.5 MMTh115% of 5.7 MMTh goalCascade Natural Gas0.59 MMTh108% of 0.55 MMTh goalAvista0.41 MMTh117% of 0.35 MMTh goal -
2.39 aMW
126% of 1.89 aMW goalReview the breakdownPGE1.33 aMW124% of 1.08 aMW goalPacific Power1.06 aMW130% of 0.82 aMW goal
-
Since 2002
Public Benefit from $1.8 Billion Investment by Energy Trust
-
$7.7billion
-
$7.3billion
-
29.3million tons
Transparency + Accountability
Energy Trust is governed by a volunteer board of directors and is overseen by the Oregon Public Utility Commission. Stakeholder advisory councils guide our work.
Accountable And Transparent
- Every dollar received and invested is accounted for in monthly, quarterly and annual financial statements.
- Financial statements are audited annually by an independent auditor; Energy Trust has a perfect track record of unmodified financial options.
- Each kilowatt hour and therm acquired is reported in quarterly and annual reports.
- All major programs are evaluated by a third party.
- We contract for an independent management audit every five years.
- We established diversity, equity and inclusion goals in 2018.
Revenues And Expenditures
- Revenues totaled $188.1 million.
- Expenditures totaled $174.8 million.
- Delivered $94.3 million in incentives, with most of the remainder for delivery of customer services.
- Maintained low administrative and program support costs at 5.7 percent ($10.8 million) of revenue.
Measuring 2018 Performance
We exceeded performance measures set by the Oregon Public Utility Commission.
- Achieved 95 percent customer satisfaction
- Kept staffing expenditures at 6.8 percent of total expenditures on a three-year rolling average
- Benefits of all programs far exceeded costs
| Category | 2018 Performance Measures | 2018 Results | Status |
|---|---|---|---|
| PGE efficiency | Save at least 30.9 aMW | Exceeded, with 34.7 aMW saved | |
| Levelized cost not to exceed 3.3 cents/kWh | Within requirement, levelized cost at 2.7 cents/kWh | ||
| Pacific Power efficiency | Save at least 17.2 aMW | Exceeded, with 19.3 aMW saved | |
| Levelized cost not to exceed 3.6 cents/kWh | Within requirement, levelized cost at 2.9 cents/kWh | ||
| NW Natural efficiency | Save at least 4.8 million annual therms | Exceeded, with 6.5 million annual therms saved | |
| Levelized cost not to exceed 37 cents/therm | Within requirement, levelized cost at 26.4 cents/therm | ||
| Cascade Natural Gas efficiency | Save at least 0.47 million annual therms | Exceeded, with 0.59 million annual therms saved | |
| Levelized cost not to exceed 43 cents/therm | Within requirement, levelized cost at 27.9 cents/therm | ||
| Avista efficiency | Save at least 0.30 million annual therms | Exceeded, with 0.41 million annual therms saved | |
| Levelized cost not to exceed 25 cents/therm | Within requirement, levelized cost at 24.7 cents/therm | ||
| Renewable energy | For project and development assistance (part 1), deploy at least $1.72 million in non-solar project development assistance incentives. Maintain a non-solar project development assistance pipeline in excess of 25 projects. Report number of projects served, total dollars spent, and summarize project progress through development stages. | In compliance, paid $2,524,938 and committed $1,749,327 in project development assistance to 31 projects. | |
| For project and market development assistance (part 2), report annual results, including number of projects supported, milestones met and documentation of results from market and technology perspective. | In compliance | ||
| Obtain at least 1.6 aMW of installed generation of standard net-metered Solar program projects. | Exceeded, with 2.3 aMW of installed generation from standard solar projects | ||
| For solar projects funded outside of the Solar program’s standard, net-metered incentive offer, report sources of funding for projects and the criteria for selection. | In compliance, program did not dedicate funds for custom solar projects in 2018 | ||
| Financial integrity | Receive an unmodified financial opinion from an independent auditor on annual financial statements | In compliance, with an unmodified financial audit opinion for 2018 | |
| Administrative/ program support costs | Keep administrative/program support costs below 8 percent of annual revenues | Within requirement, with 2018 administrative and program support costs at 5.7 percent of annual revenues | |
| Staffing expenditures | Total staffing expenditures not to exceed 7.75 percent of total organization expenditures calculated on a three-year rolling average for public purpose funded activities in Oregon | In compliance, with a three-year rolling average staffing cost of 6.8 percent of total organization expenditures for 2015-2018 | |
| Customer satisfaction | Demonstrate greater than 85 percent satisfaction rates for interaction with program representatives and overall satisfaction | Achieved, with a 97 percent satisfaction rate for interaction with program representatives and a 95 percent overall satisfaction rate. Results for major programs are averaged to determine satisfaction rates. | |
| Benefit/cost ratios | Report utility system and total resource perspective annually. Report significant mid-year changes as warranted in quarterly reports. | Achieved, with no mid-year changes | |
| Northwest Energy Efficiency Alliance and market transformation | Report annually: • Savings and costs • Savings strategies • Show Energy Trust direction to NEEA through committee membership • Summary of Energy Trust direction to NEEA • Summary of NEEA initiatives Energy Trust opts out of and why | In compliance |