2019 Annual Report
Clean and Affordable Energy for Oregon

Improving Communities
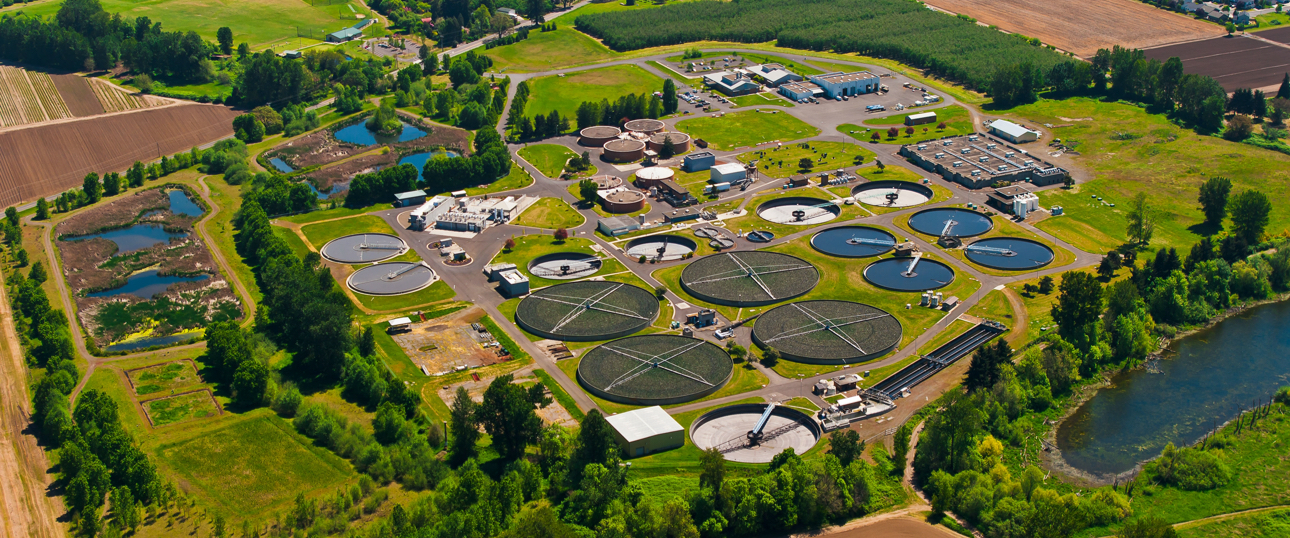
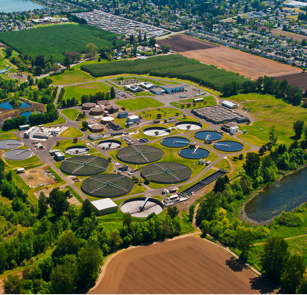
From Oregon’s rural counties to its capital city, local governments, residents and employers are better managing resources, supporting jobs and reducing energy bills.

Industry Block Header
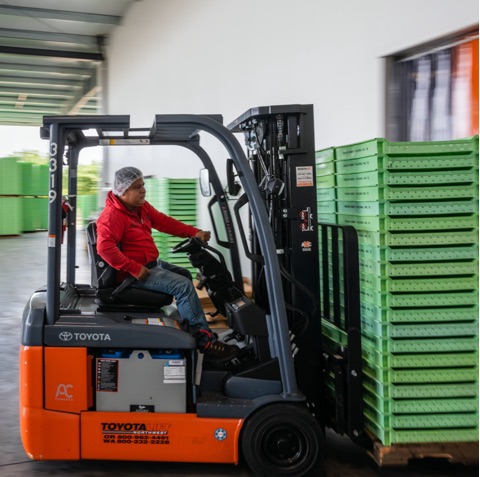
Oregon’s factories are modernizing operations and finding efficiencies that save time, labor and money.
Improving Business
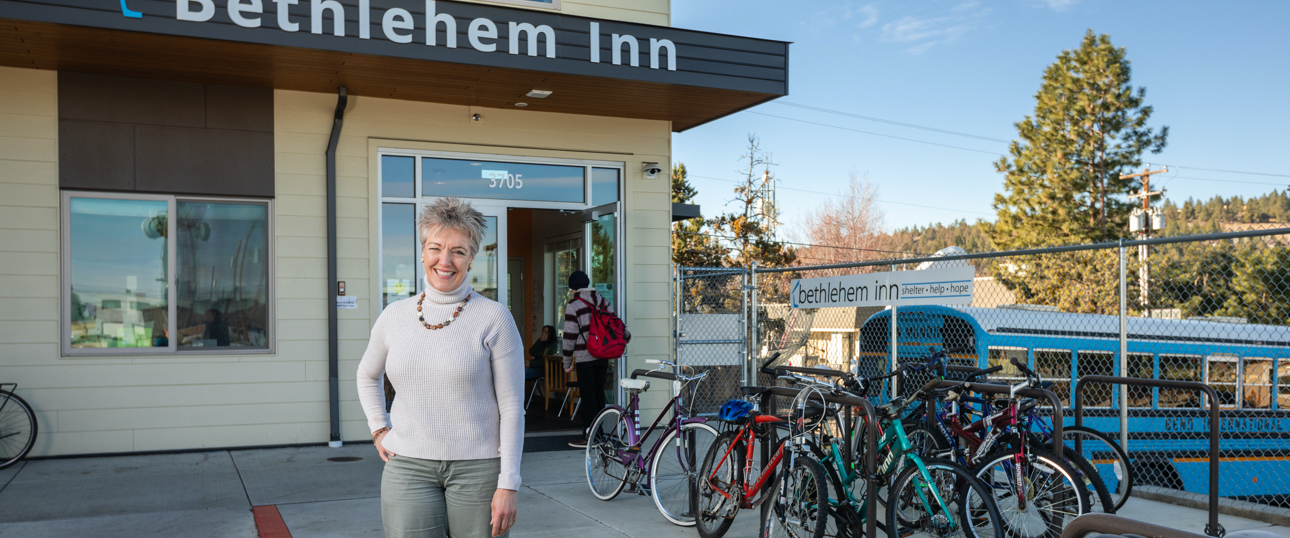
Businesses and nonprofits around the state are investing in upgrades that improve customer satisfaction, employee safety and bottom-line success.

Improving Homes
From manufactured homes to affordable housing, people are finding and fixing inefficiencies that improve comfort and put money back into their pockets.
Success Stories
We help communities, business, factories, farms and families save on energy bills and invest in renewable power.


Our Impact
Clean energy benefits have a ripple effect in communities across the state.

Improved economy
Adding $8.3 billion to Oregon’s economy.

Good jobs
Supporting 1,900 local businesses with 12,000 employees via our Trade Ally Network.

Cleaner air
Avoiding enough CO2 to remove 7 million cars from the road last year.
Goals & Results
We delivered strong natural gas savings and achieved electric savings and renewable generation goals.
-
53.3 aMW
100% of 53.2 aMW goalPortland General Electric32.8 aMW98% of 33.5 aMW goalPacific Power20.5 aMW104% of 19.7 aMW goal -
5.9 MMTh
98% of 6.0 MMTh GoalNW Natural5.0 MMTh97% of 5.2 MMTh GoalCascade Natural Gas0.51 MMTh98% of 0.51 MMTh GoalAvista0.36 MMTh107% of 0.36 MMTh Goal -
2.7 aMW
121% of 2.3 aMW goalPortland General Electric1.5 aMW119% of 1.2 aMW goalPacific Power1.3 aMW122% of 1.0 aMW goal
-
Since 2002
Oregon benefits from $2 billion invested by Energy Trust
-
$8.2Billion
-
$8.3Billion
-
32.7Million Tons
Transparency & Accountability
We are governed by a volunteer board of directors and overseen by the Oregon Public Utility Commission. Three stakeholder advisory councils guide our work.
Accountable and Transparent
- Every dollar received and invested is accounted for in monthly, quarterly and annual financial statements.
- Financial statements are audited annually by an independent auditor. Energy Trust has a perfect track record of unmodified financial audits.
- Each kilowatt hour and therm acquired is reported in quarterly and annual reports.
- All major programs are evaluated by a third party.
- We contract for an independent management audit every five years.
Revenues And Expenditures
- Revenues totaled $183.5 million.
- Expenditures totaled $183.7 million.
- Delivered $99.9 million in incentives, with most of the remainder for delivery of customer services.
- Maintained low administrative and program support costs at 6.2% ($11.4 million) of revenue.
Measuring 2019 Performance
We exceeded performance measures set by the Oregon Public Utility Commission.
- Achieved 96% customer satisfaction
- Kept administrative and program support costs to 6.24% of annual revenues
- Benefits of all programs far exceeded costs
| Category | 2019 Performance Measures | 2019 Results | Status |
|---|---|---|---|
| PGE efficiency | Save at least 28.5 aMW | Exceeded, with 32.8 aMW saved | |
| Levelized cost not to exceed 3.5 cents/kWh | Within requirement, levelized cost at 3.0 cents/kWh | ||
| Pacific Power efficiency | Save at least 16.8 aMW | Exceeded, with 20.5 aMW saved | |
| Levelized cost not to exceed 3.7 cents/kWh | Within requirement, levelized cost at 2.9 cents/kWh | ||
| NW Natural efficiency | Save at least 4.4 million annual therms | Exceeded, with 5 million annual therms saved | |
| Levelized cost not to exceed 44 cents/therm | Within requirement, levelized cost at 39.13 cents/therm | ||
| Cascade Natural Gas efficiency | Save at least 0.43 million annual therms | Exceeded, with 0.5 million annual therms saved | |
| Levelized cost not to exceed 48 cents/therm | Within requirement, levelized cost at 41.34 cents/therm | ||
| Avista efficiency | Save at least 0.30 million annual therms | Exceeded, with 0.38 million annual therms saved | |
| Levelized cost not to exceed 43 cents/therm | Within requirement, levelized cost at 34.3 cents/therm | ||
| Renewable energy | For project and development assistance (part 1), deploy at least $1.63 million in non-solar project development assistance incentives. Maintain a non-solar project development assistance pipeline in excess of 25 projects. Report number of projects served, total dollars spent, and summarize project progress through development stages. | In compliance, paid $1,969,938 and committed $1,658,109 in project development assistance to 28 projects | |
| For project and market development assistance (part 2), report annual results, including number of projects supported, milestones met and documentation of results from market and technology perspective | In compliance | ||
| Obtain at least 1.7 aMW of installed generation of standard net-metered Solar program projects | Exceeded, with 2.3 aMW of installed generation from standard solar projects | ||
| For solar projects funded outside of the Solar program’s standard, net-metered incentive offer, report sources of funding for projects and the criteria for selection | In compliance, program did not dedicate funds for custom solar projects in 2019 | ||
| Financial integrity | Receive an unmodified financial opinion from an independent auditor on annual financial statements | In compliance, with an unmodified financial audit opinion for 2019 | |
| Administrative/program support costs | Keep administrative/program support costs below 8% of annual revenues (no more than $14,675,399) | Within requirement, with 2019 administrative and program support costs of 6.24% of annual revenues ($11,420,383) | |
| Administrative/program support cost growth limited to 10% year-over-year increase (no more than $1,309,717) | In compliance, with administrative/program support cost growth of 5.66% year-over-year ($574,492) | ||
| Staffing expenditures | Total staffing expenditures not to exceed 7.25% of total organization expenditures calculated on a three-year rolling average for public purpose funded activities in Oregon | In compliance, with a three-year rolling average staffing cost of 7.16% of total organization expenditures for 2016-2019 calculated on a three-year rolling average for public purpose funded activities in Oregon | |
| Staffing cost growth limited to 10% year-over-year increase | In compliance, with staffing cost growth of 4.35% year-over-year | ||
| Customer satisfaction | Demonstrate greater than 85% satisfaction rates for interaction with program representatives and overall satisfaction | Achieved, with a 98% satisfaction rate for interaction with program representatives and a 96% overall satisfaction rate | |
| Benefit/cost ratios | Report utility system and total resource perspective annually; Report significant mid-year changes as warranted in quarterly reports | Achieved, with no mid-year changes | |
| Northwest Energy Efficiency Alliance and market transformation | Report annually: • Savings and costs • Savings strategies • Show Energy Trust direction to NEEA through committee membership • Summary of Energy Trust direction to NEEA • Summary of NEEA initiatives Energy Trust opts out of and why | In compliance |